Understanding Financial Return Formulas
In finance, “return” quantifies the profit or loss made on an investment over a period. It’s a crucial metric for evaluating investment performance and comparing different opportunities. Several formulas exist to calculate return, each suited for different scenarios and investment types. Understanding these formulas is essential for making informed financial decisions.
Simple Return (Holding Period Return):
The most basic measure is the Simple Return or Holding Period Return (HPR). It’s calculated as:
Return = (Ending Value - Beginning Value) / Beginning Value
For example, if you bought a stock for $100 and sold it for $110, your simple return would be (110 – 100) / 100 = 0.10 or 10%. This formula is straightforward but doesn’t account for the time value of money or any cash flows received during the investment period, such as dividends.
Annualized Return:
To compare investments held for different periods, you need to annualize the return. This converts a return earned over a shorter period into an equivalent annual rate. The formula is:
Annualized Return = (1 + Holding Period Return)^(365 / Holding Period in Days) - 1
For instance, if an investment yielded a 5% return over 90 days, the annualized return would be (1 + 0.05)^(365/90) – 1 ≈ 0.2206 or 22.06%. This allows for a fair comparison with investments held for a full year.
Total Return:
Total Return incorporates all cash flows received during the investment period, such as dividends or interest payments. The formula is:
Total Return = (Ending Value + Cash Flows - Beginning Value) / Beginning Value
Say you bought a bond for $1,000 that paid $50 in interest and you eventually sold it for $1,050. The total return is (1050 + 50 – 1000) / 1000 = 0.10 or 10%. This formula provides a more complete picture of the investment’s profitability.
Average Annual Return:
For investments held over multiple years with fluctuating returns, the Average Annual Return is used. This is simply the sum of the annual returns divided by the number of years.
Average Annual Return = (Year 1 Return + Year 2 Return + ... + Year N Return) / N
For instance, if an investment returned 10% in year 1, 5% in year 2, and 15% in year 3, the average annual return would be (10 + 5 + 15) / 3 = 10%.
Compound Annual Growth Rate (CAGR):
CAGR represents the constant rate at which an investment would have grown if it had compounded annually. It’s a more accurate representation of long-term growth compared to average annual return. The formula is:
CAGR = (Ending Value / Beginning Value)^(1 / Number of Years) - 1
If an investment grew from $1,000 to $1,500 over 5 years, the CAGR would be (1500 / 1000)^(1/5) – 1 ≈ 0.0845 or 8.45%. CAGR smooths out volatility and provides a more realistic picture of the investment’s sustained growth rate.
Risk-Adjusted Return:
While return is essential, it’s crucial to consider the risk taken to achieve that return. Risk-adjusted return measures, like the Sharpe Ratio, take into account the volatility of the investment. A higher Sharpe Ratio indicates better risk-adjusted performance.
In conclusion, choosing the appropriate return formula depends on the specific investment and the information you want to glean. Always consider the context and limitations of each formula to accurately assess investment performance.
 1090×676 formule rendement formule from f0rmule.blogspot.com
  953×559 rendement berekenen formule rekentool from hoebeginik.nl
  1868×605 decouvrir imagen formule de taux de rentabilite frthptnganamst from fr.thptnganamst.edu.vn
  1280×720 decouvrir imagen formule calcul rendement frthptnganamsteduvn from fr.thptnganamst.edu.vn
  480×125 decouvrir imagen valeur actualisee formule frthptnganamsteduvn from fr.thptnganamst.edu.vn
  1280×720 ntroduire imagen formule rendement placement frthptnganamsteduvn from fr.thptnganamst.edu.vn
  1395×743 decouvrir imagen formule de calcul de la van frthptnganamsteduvn from fr.thptnganamst.edu.vn
  1280×720 ntroduire imagen taux de rentabilite formule gestion fr from fr.thptnganamst.edu.vn
  626×501 le taux de rendement interne ou tri est une formule utilisee en analyse from fr.freepik.com
  730×840 decouvrir imagen formule du rendement frthptnganamsteduvn from fr.thptnganamst.edu.vn
  960×720 ntroduire imagen formule du rendement moteur frthptnganamsteduvn from fr.thptnganamst.edu.vn
  626×501 la formule du taux de rendement attendu est le montant auquel from fr.freepik.com
 .png?width=740&name=FYGR%20-%20Blog%20illustrations%20(4).png) 740×299 ntroduire imagen ratio de rentabilite economique formule fr from fr.thptnganamst.edu.vn
740×299 ntroduire imagen ratio de rentabilite economique formule fr from fr.thptnganamst.edu.vn 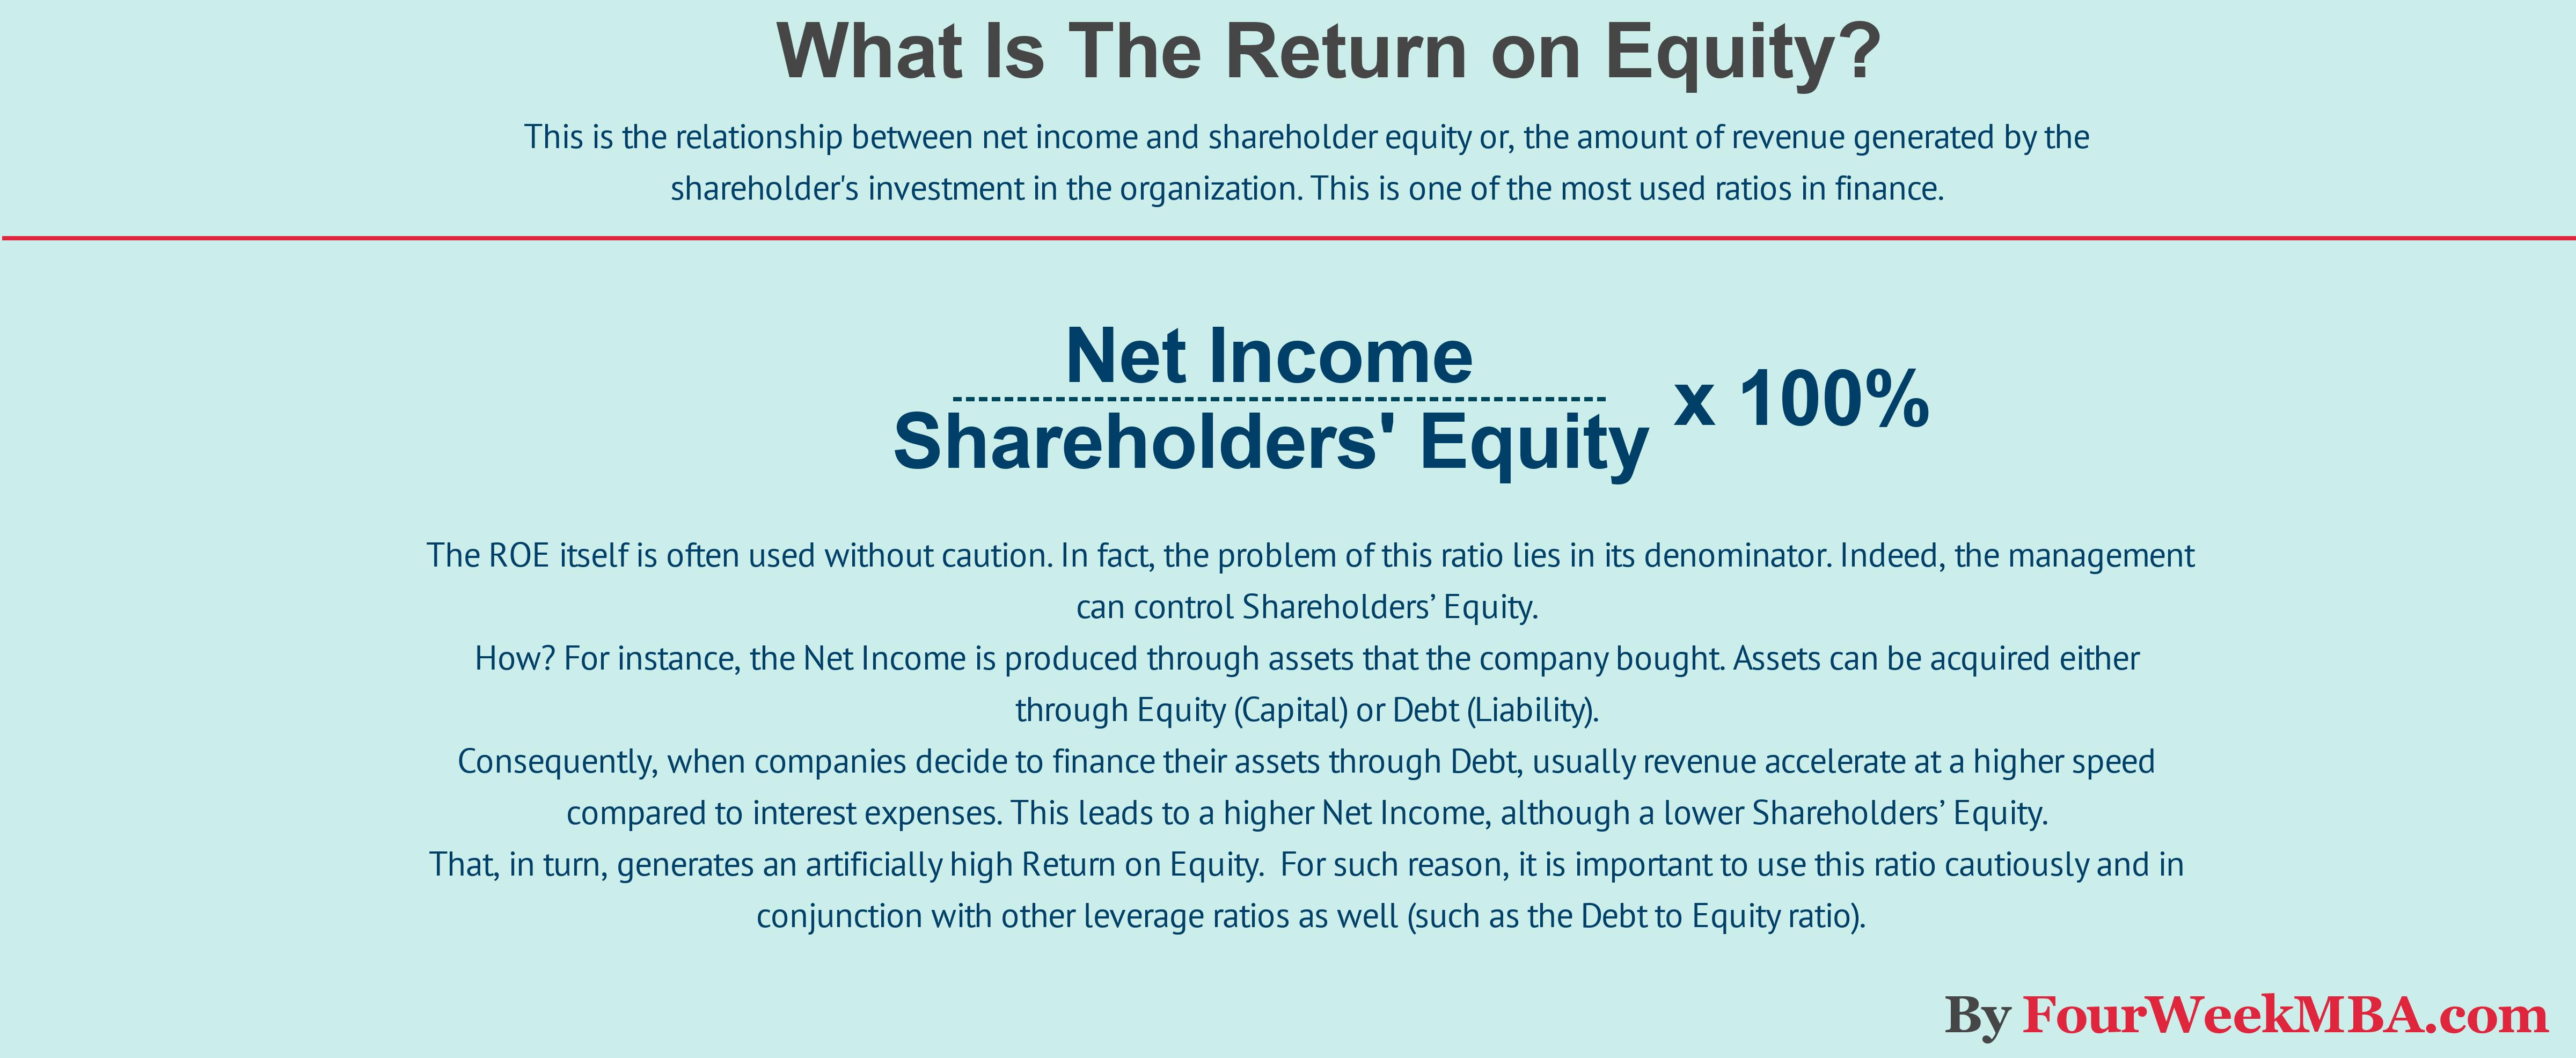 4800×1972 ntroduire imagen rendement des capitaux propres formule fr from fr.thptnganamst.edu.vn
  1300×650 ntroduire imagen rendement une action formule frthptnganamst from fr.thptnganamst.edu.vn
  1096×314 calculer son rendement finance investissement from www.finance-investissement.com
  1232×928 calcul du rendement annuel methodes etapes essentielles magazine from www.magazine-finance.fr
  0 x 0 taux de rendement youtube from www.youtube.com
  0 x 0 formule calcul rendement placement excel youtube from www.youtube.com
  0 x 0 le taux de rendement comptable ou taux de moyen de rendement from www.youtube.com
  600×338 rendement from view.genial.ly
  812×1024 rendement excel from opiasolutions.com
  320×240 le rendement financier from neumann.hec.ca
  0 x 0 comment calculer le rendement moyen annualise de son portefeuille from www.youtube.com
  0 x 0 comment est calcule le rendement dune action en bourse youtube from www.youtube.com
  0 x 0 comment determiner le rendement le risque dune action youtube from www.youtube.com
  0 x 0 excel calculer la van le tri valeur actuelle nette taux de from www.youtube.com
  0 x 0 le rendement financier critere de selection priorisation de projet from www.youtube.com
  736×1104 quest ce le rendement financier from www.pinterest.co.uk
